
This is part of a series on the financial analysis of the NU System. Go to the previous post or the next post.
Ok, so we now have a clearer picture that the whole NU system is on solid financial footing. So solid that their bond rating puts them in the top 8% of all universities. That’s the only area in which they top the ratings.
But now let’s turn to the UNL campus, where the current program cuts and mergers, and buyouts are happening.
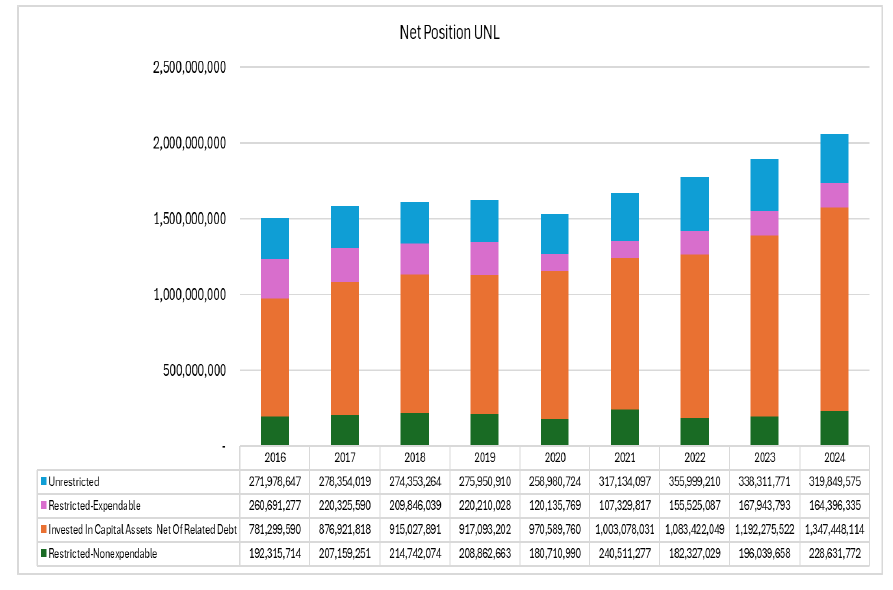
The table below shows the net position of just UNL. Again, net position is like your home equity. The capital assets (buildings, land, and equipment, minus the associated debt) is in orange. The assets that are restricted and nonexpendable in perpetuity is in the dark green. The restricted expendables, restricted for a specific time or purpose, are pink. The unrestricted funds are in the light blue. Dr. Garrity’s conclusion based on this data is that “UNL has a sizable level of unrestricted assets, which are the most flexible for the institution. Increasing net position and unrestricted net position are signs of a financially healthy institution.”
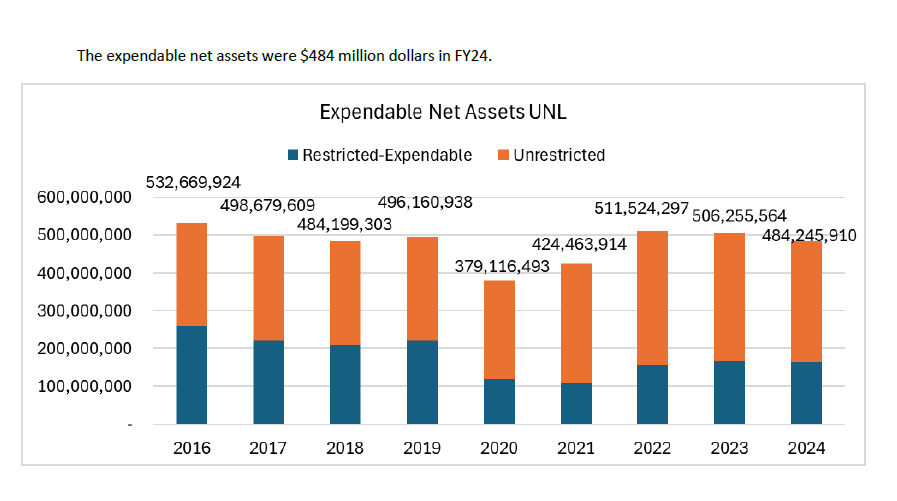
The chart below breaks out just the expendable assets. Like the money in your checking and savings account. It’s spendable now. You’ll see the now familiar 2020 dip, but the expendable resources have recovered. The unrestricted proportion has grown since before COVID.
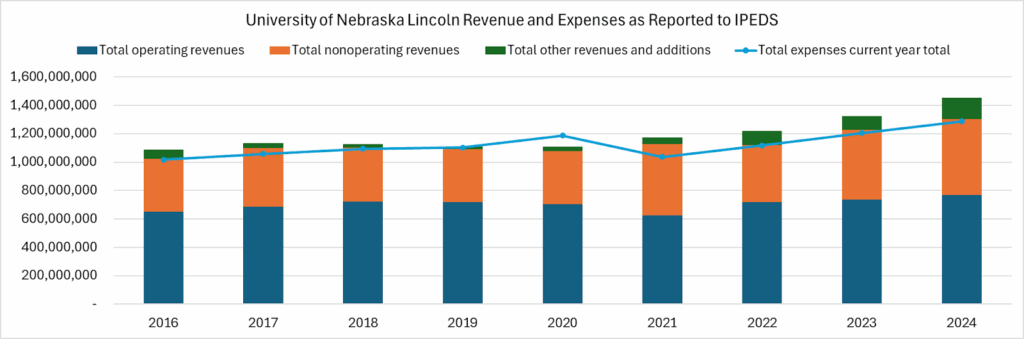
This table shows the revenues compared to expenses. The total expenses line, in the light blue, is below the revenue bar with the exception of 2020. Curiouser and curioser.
The report’s next several charts show that revenues across the five largest areas (tuition, sales & services, gifts, federal operating grants & contracts, and state appropriations) have all ticked up since 2016. That should be good news for UNL. And yet it has not translated to good news for faculty and staff. With the 5% tuition increase, we can expect stronger revenues, assuming we can maintain stable enrollment (although this is a harder task when you cut programs and scare off students).
Let’s conclude with this table, which shows the strong state appropriations per FTE at UNL. State aid helps keep UNL affordable for students and hopefully helps more of them choose UNL, which in turn can only help more young people stay in Nebraska.


Looking for a different post on the financial report?
- AAUP Financial Analysis Part 1: Introduction
- AAUP Financial Analysis Part 2: Overall Financial Strength of the University of Nebraska System
- AAUP Financial Analysis Part 3: What about UNL?
- AAUP Financial Analysis Part 4: Expenses
- AAUP Financial Analysis Part 5: Instructional Investment
- AAUP Financial Analysis Part 6: Where is the Money Going?
- AAUP Financial Analysis Part 7: NU Bond Rating
- Has Anyone Checked the Couch Cushions at Varner Hall?
