
This is part of a series on the financial analysis of the NU System. Go to the previous post or the next post.
Whatever you choose to do as a leader, it should be aligned to the vision and the mission of the organization. UNL’s can be found here. Here is an excerpt: “Through its three primary missions of teaching, research, and service, the university is the state’s primary intellectual center, providing leadership throughout the state through quality education and the generation of new knowledge.”
We are a Research I university, but it is no mistake that teaching and quality education come before research and knowledge generation. As a land-grant university, UNL exists to provide a high-quality post-secondary education to the young people of Nebraska. We do that through our undergraduate and graduate teaching.
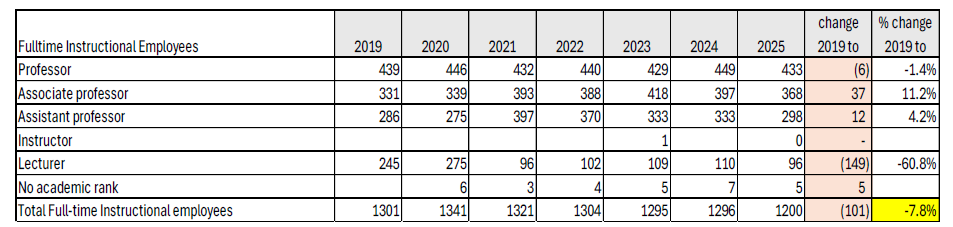
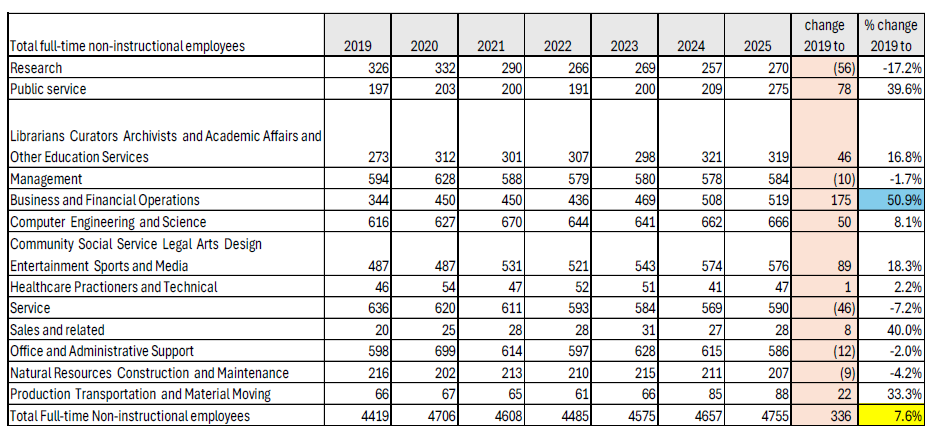
Budgets are an expression of values and the makeup of university employees is a reflection of the organization’s priorities. The two tables below demonstrate a shift away from the full-time employees who teach. The number has decreased by nearly 8% in the last six years. Meanwhile, non-instructional staff have increased by nearly the same amount. Notably, the Business and Financial Operations line grew by almost 51%. Salaries for this category of employee increased by about 76% over the same period, suggesting that not only did UNL hire more employees in this area, they are paying them more. This is the second largest increase in salary. The first is in public service, which grew by nearly 40% in size and nearly 90% in pay. I’m not entirely sure which employees fall under this category.
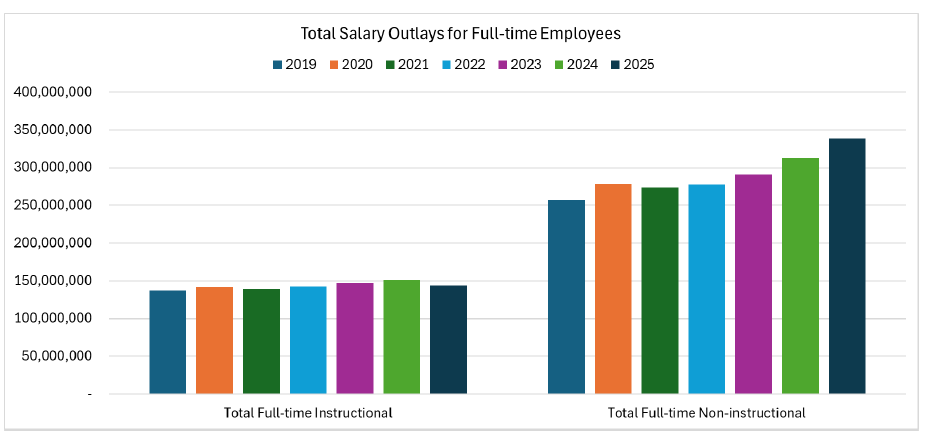
The graph below demonstrates that overall, between the number of instructional full-time employees and their wages, the total salary outlays for instruction have stagnated and, in fact, dipped in 2025. At the same time salary outlays for non-instructional staff have gone up.
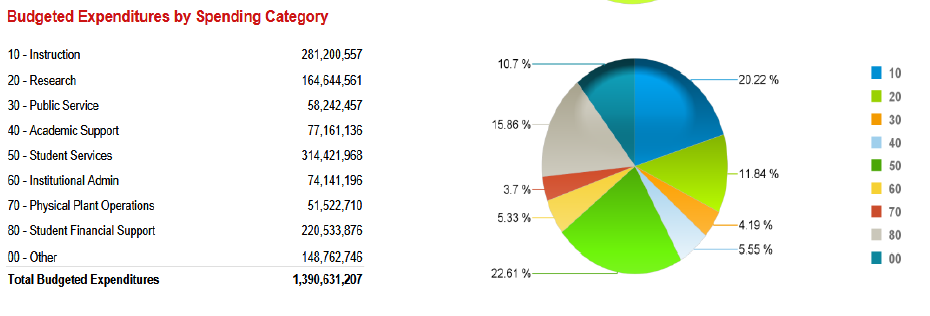
We get a similar picture looking at expenditures by category… Instruction is not the biggest piece of the pie. Which seems sort of surprising given its salience in the mission and vision statement. Instruction makes up about 20%o of UNL’s expenses.
Yet, as Dr. Garrity pointed out, instruction is being asked to absorb 69% of the proposed cuts. She concludes:
It appears that the administration is doubling down on its recent history of deprioritizing instruction and students. It is time to defend instruction at the University of Nebraska at Lincoln and resist cuts that would undermine the educational mission.

Check out the rest of this series:
- AAUP Financial Analysis Part 1: Introduction
- AAUP Financial Analysis Part 2: Overall Financial Strength of the University of Nebraska System
- AAUP Financial Analysis Part 3: What about UNL?
- AAUP Financial Analysis Part 4: Expenses
- AAUP Financial Analysis Part 5: Instructional Investment
- AAUP Financial Analysis Part 6: Where is the Money Going?
- AAUP Financial Analysis Part 7: NU Bond Rating
- Has Anyone Checked the Couch Cushions at Varner Hall?
