
This is part of a series on the financial analysis of the NU System. Go to the previous post or the next post.
And onto Part 6 of the AAUP financial analysis. For this post, we’re going to back to the analysis done in 2019. Before we get into the graph below, its important to recognize the differences in the scale and scope of each of the campuses that make up the NU System. Based on the most recent data from IPEDS, NU System enrolls about 48,800 students. Forty-nine percent of those students attend UNL. Based on numbers from each campus, in academic year 2019-20, NU enrolled about 50,780 students. Of those 51% attended UNL.
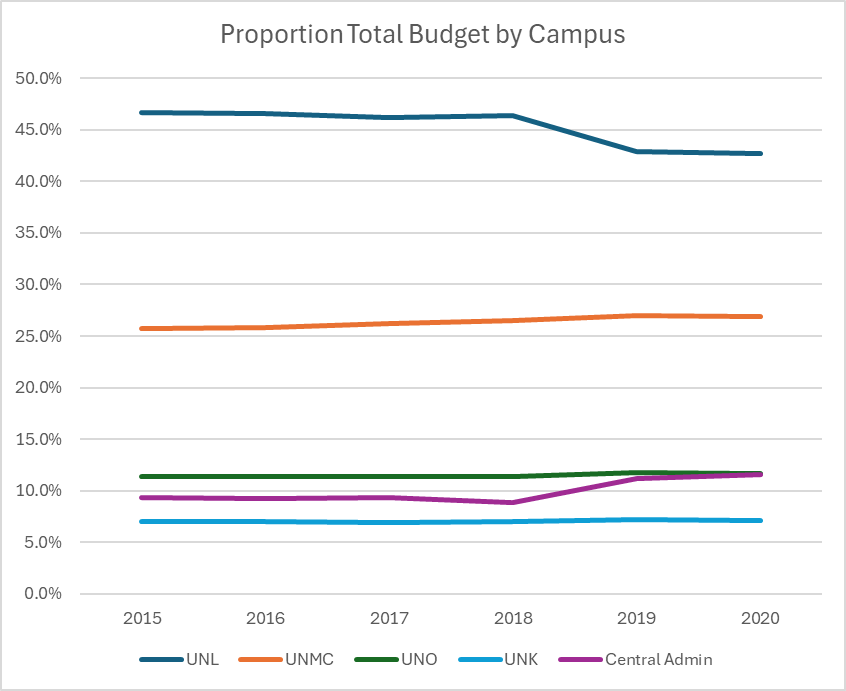
This chart was made from data from a 2019 report on the budgets from across the NU campuses, prepared by Rudy Fichtenbaum (then the AUP national president and professor of Economics at Wright State University) and Howard Bunis (professor of accounting at Eastern Michigan University). Dr. Garrity’s 2025 report doesn’t include this information, but we want to call attention to the shift in resources here, even if it seems quite small. While we note there has been a decline in enrollment of the proportion of students enrolled at UNL from 2019-2020 to 2023-24, we note that the proportion of the budget at UNL dropped below 45%. Funding for the other campuses was remarkably stable from 2015 to 2020. What has gone up is the proportion of the budget going to Central Admin.
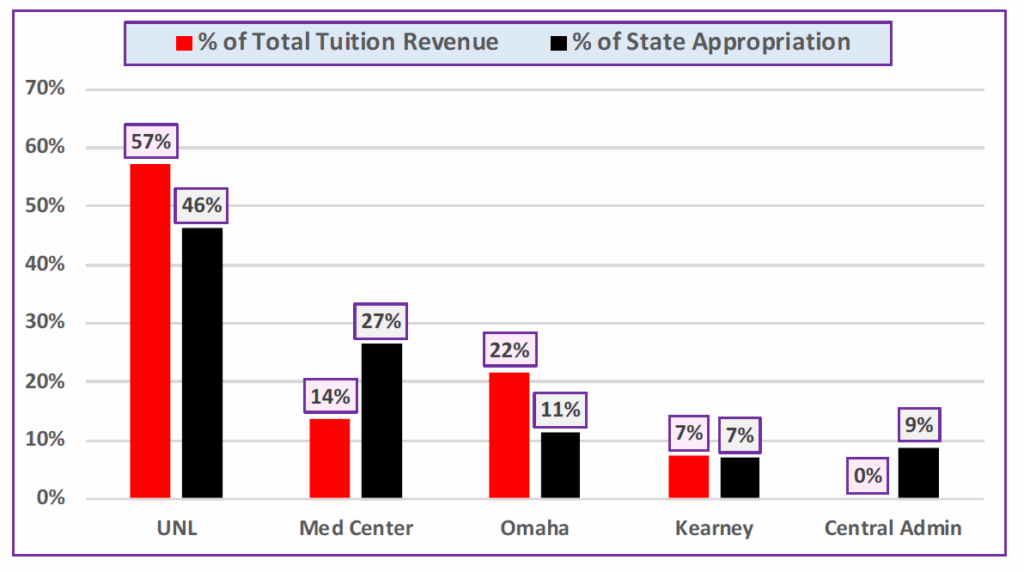
In case anyone was curious, the number of students enrolled at Varner Hall is, and has been 0.
This chart taken directly from the 2019 report, makes it clear that by 2020 a shift of funds to Central Administration was well underway.
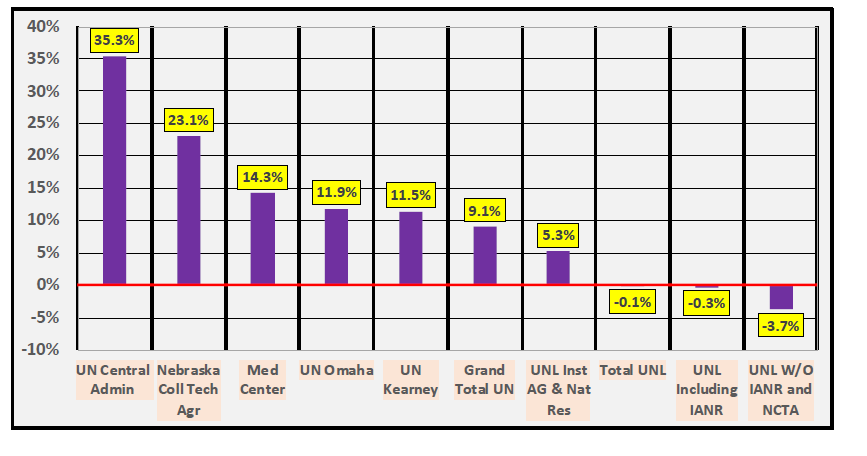
This seems like the beginning of a bigger shift in diverting funds that one of our friends in Journalism tracked in the analysis below. The proportion of the total NU budget that goes to UNL has decreased by 24% using inflation-adjusted dollars. The proportion that has gone to NU System Administration has increased 56%.

Why does this matter? A similar pattern has emerged in P-12 education. An increasing glut of central office administrators make many times more than teachers, who are increasingly overworked, underpaid, frustrated, and leaving the field. We imagine that, like us, many faculty members can relate.
What is the value added of these administrators if they aren’t making teachers’ lives easier and creating the environments for them to do their best work? That question can be asked here as well. What is Varner Hall doing to make your life easier? What have they done to improve your instruction or your research?
And of course, zero students translates to 0% tuition revenue.

Looking for a different post on the financial report?
- AAUP Financial Analysis Part 1: Introduction
- AAUP Financial Analysis Part 2: Overall Financial Strength of the University of Nebraska System
- AAUP Financial Analysis Part 3: What about UNL?
- AAUP Financial Analysis Part 4: Expenses
- AAUP Financial Analysis Part 5: Instructional Investment
- AAUP Financial Analysis Part 6: Where is the Money Going?
- AAUP Financial Analysis Part 7: NU Bond Rating
- Has Anyone Checked the Couch Cushions at Varner Hall?
