
This is part of a series on the financial analysis of the NU System. Go to the previous post or the next post.
Ok, let’s start with the bigger picture, the overall University of Nebraska: UNL, UNO, UNK, UNMC, and the Systems Office at Varner Hall.
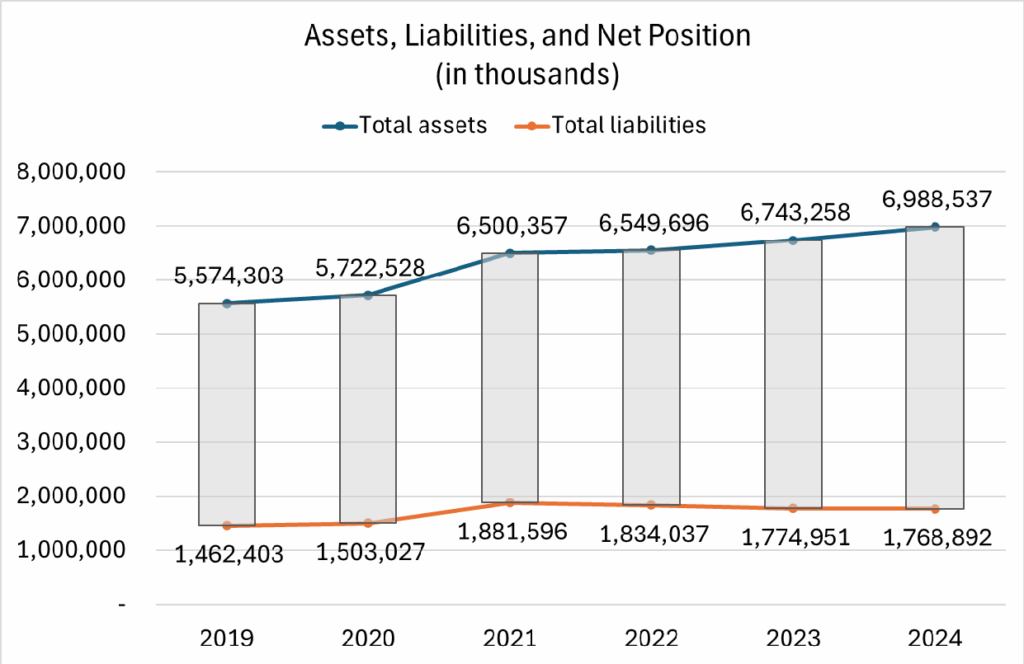
The chart above demonstrates the improvement in the net position of the NU System from 2019-2024, or the difference between the total assets and the liabilities. This is essentially akin to home equity as the difference between the value of your home and what you owe on it. Of course, a good deal of those assets are like our homes, putting literal roofs over our heads in the form of land, buildings, equipment, and other capital assets.
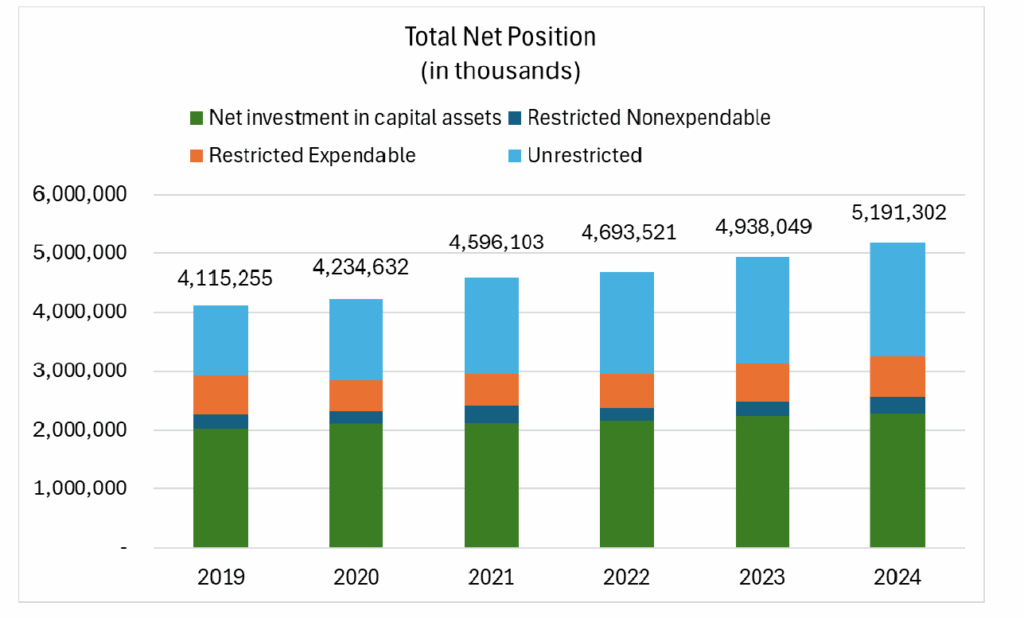
In the chart below, those assets are in green. Those are pretty big portions of the assets, but so are the light blue sections, the unrestricted expendable assets. Along with the increase in net position, or equity, the growth of this slice points to a healthy financial organization.
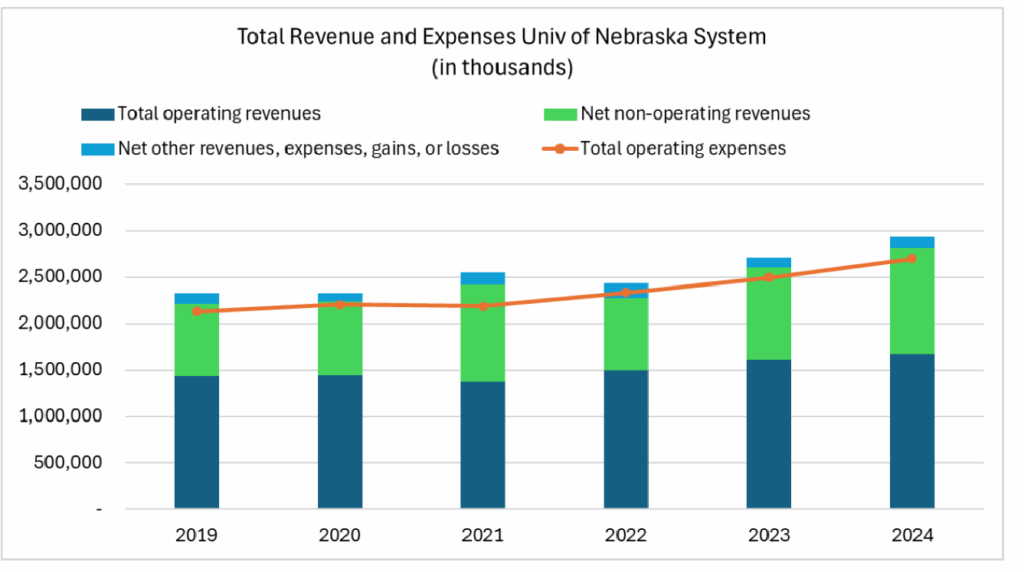
Additionally, the chart below demonstrates that the NU System has LOWER expenses than total revenue each year from 2019-2024. We don’t know about you, but we found this shocking after being told for years that we have a structural deficit. Do you see a structural deficit here?
Perhaps someone may respond that while the system is financially healthy, UNL is in a budget crisis. But how is the overall system operating in black if the flagship university is so chronically in the red even after nearly a decade of budget cuts?
If this isn’t astonishing enough, there’s more. Check out the chart below. This chart shows the cash flow from operating activities, including tuition and fees, and payments to employees and suppliers. That is, the money coming in minus the money going out.
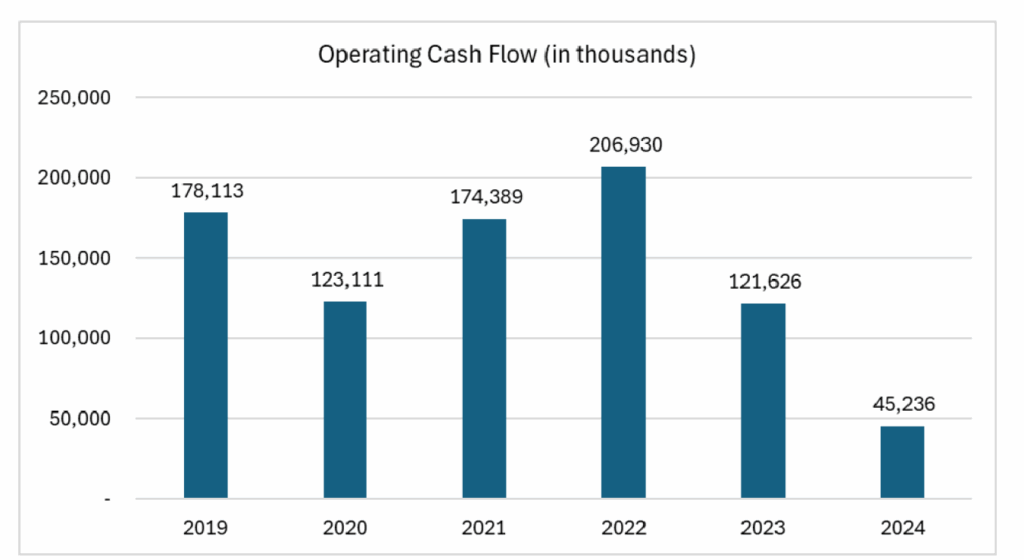
What do you notice about this graph? Sure, the number has gone down since 2022. But it is also positive. Huh? Since that is in thousands, we’re looking at a positive cash flow of $45,236,000.00. The downward trend may need to be addressed–and a transparent discussion of the numbers would be a start–but $45 million in positive cash flow makes it very difficult to understand why $12 million was cut from the flagship in 2024 and $10.8 million in 2023 and now millions in program cuts are being demanded.
Maybe this is all a rhetorical move on the part of administrators to maintain state aid levels. Everyone wants to see state aid continue at high levels. It is good for students, it is good for Nebraska. And it is a good return on investment economically for the state. Maybe administrators just have to cry poor to convince the Legislature and governor to do the right thing and invest in the university.
Or maybe this structural deficit is the result of strategic resource cuts to the flagship university. We can only speculate, since the university has chosen not to include faculty in budget decision-making, despite its stated commitment to shared governance. But we can say that just like Bigfoot and the Loch Ness monster, no one has actually seen the structural deficit.
Check out the rest of this series:
Looking for a different post on the financial report?
- AAUP Financial Analysis Part 1: Introduction
- AAUP Financial Analysis Part 2: Overall Financial Strength of the University of Nebraska System
- AAUP Financial Analysis Part 3: What about UNL?
- AAUP Financial Analysis Part 4: Expenses
- AAUP Financial Analysis Part 5: Instructional Investment
- AAUP Financial Analysis Part 6: Where is the Money Going?
- AAUP Financial Analysis Part 7: NU Bond Rating
- Has Anyone Checked the Couch Cushions at Varner Hall?
