
In my last post, I mentioned how incomplete Academic Analytics (AA) is at capturing every faculty member’s productivity. In this post, I’m going to be discussing the problems with how the AA data is being used by administrators in identifying departments for elimination. I could not have done this without help from my friends in the UNL Statistics Department.
The TL:DR is that administrators are not using AA for what it was designed for– comparing individual faculty members and departments with peers across the United States– they are using AA metrics to compare us within the university.
Academic Apples to Apples
According to Academic Analytics, their database, “compiles multi-faceted data on individual scholar research productivity, aggregates individual data to the academic unit level, and benchmarks academic unit data against peer units across the country.”
The reason for comparing departments within the same field is that different fields have different norms about what counts for research and creative activity. The humanities tend towards books over journal articles, for example. My college’s P & T standards state a minimum of one to two journal articles and one national conference presentation a year. To say most of us exceed these expectations is an understatement. But even within our college, our Textiles, Merchandising, and Fashion Design colleagues do not feel that their creative activity counts in the college the way it does in their field at large. So in this case, it is really important to compare them to similar departments and not say, Education Psychology. Even in my smaller educational field of Educational Administration, I don’t really want to be compared to Educational Psychology, if for no other reason than that we do very different kinds of research. My field doesn’t do basic research that can easily happen in a lab. As an applied field, our research often happens in the field, which can be messy and time-consuming.
Also of note, different fields have different types of research funding. A physics professor recently wrote to me to complain about having to submit dozens of grants a year. Some of us would be thrilled to have a dozen grants to apply to at all. In my field, there is limited federal funding, especially outside of STEM education. Do you want to study the leadership and infrastructure necessary for the large-scale implementation of high-quality K-3 reading instruction? The federal government does not have a grant for that. You’re much better off looking for funds from your state department of education or a foundation for that research. I was lucky enough to team up with some colleagues in Special Education and Communication Disorders to leverage a little bit of state funding for a three-year project that examined teachers’ perceptions of high-quality reading instruction and the instructional leadership in their building.
Units at UNL Ranked by Peer Comparisons
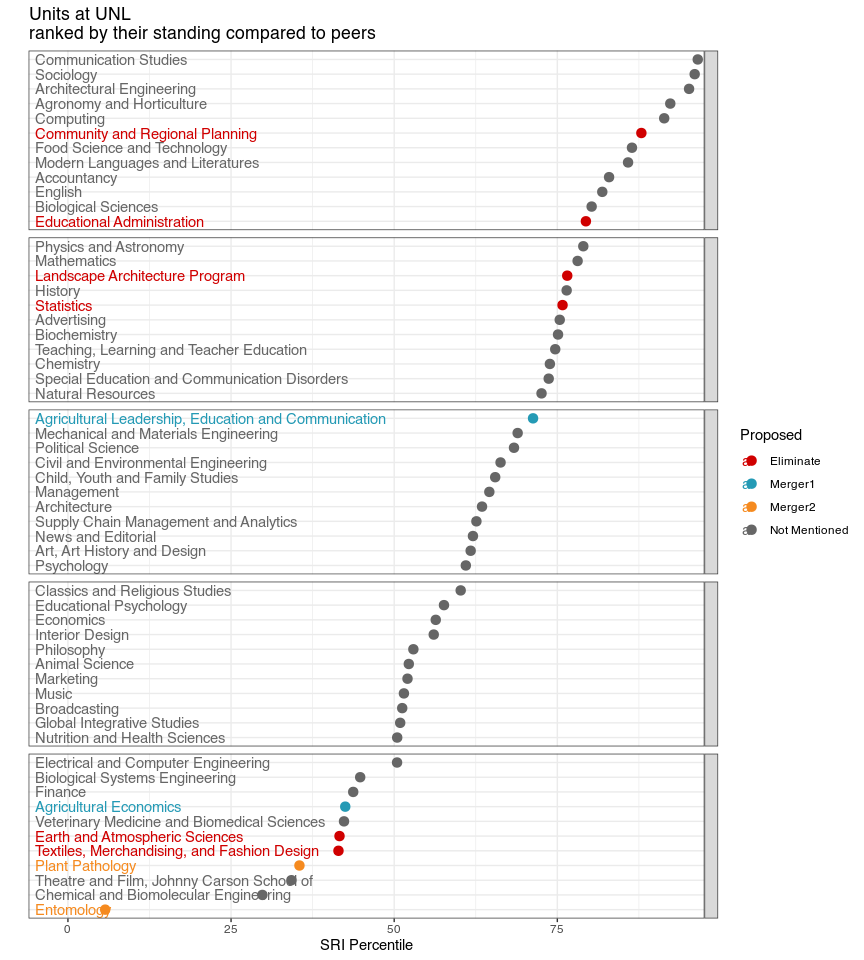
Ok, so we’ve established that AA is for comparing apples to apples and oranges to oranges. Below is a table created by the lovely members of the UNL Statistics Department, which shows the comparison of units to their peers using the default universe of all R1 and R2 institutions in the United States. That is a much larger universe than the tiny group of elite universities in the American Association of Universities (AAU) to which the administration wants to compare UNL.
When my friend in Stats first shared this with me, I was like, where is my department?
Y’all, I was only looking at the bottom tier, because from the university’s metrics, I expected to see EDAD at the bottom. Let me get this straight: compared to other departments in my field at R1s and R2, the UNL EDAD department is in the top quartile of productivity?
EDAD Ranked by Big10 Peers
I was surprised to find EDAD at the top of that chart. But I shouldn’t have been, because like my friends in Stats, I have been trying to untangle the university metrics from my perception of my department. And because I am all about that data like Megan Trainor is all about that bass, I went and collected some.
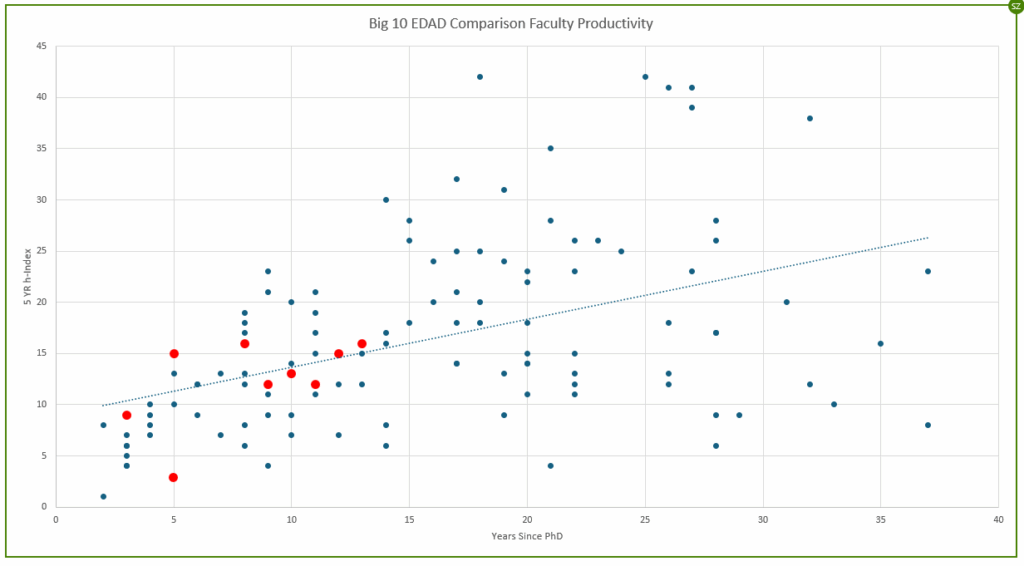
Below is a scatter plot that shows UNL EDAD’s tenure track faculty members who have research apportionments as red dots (Go Big Red!) in the universe of our Big10 peers who work in the same areas as we do, for which I could find the year they earned their Ph.D. or were first hired in a faculty position, plotted against our Google Scholar H-indexes since 2020. The h-index is an attempt to numerically capture both productivity and impact. The number represents the number of publications that have at least that many citations. This helps parse out who is publishing lots of papers no one cites or the person who wrote that one paper everyone cites but hasn’t written anything since.
I have used the “since-2020” or 5-year h-index as a measure of recent productivity and impact. My 5-year h-index is 12. So, I have 12 publications with at least 12 citations since 2020.
I literally cannot stop sharing this chart with everyone, friends, neighbors, and random strangers. Even my cats are sick of seeing it. This chart shows that while there is variation among the EDAD faculty, we are generally speaking right in line with our Big 10 peers, when you take into consideration the years since Ph.D. You’ll also note, we are as a department YOUNG. We have so much more potential for research productivity and impact.
Not Apples to Pineapples
I’m sure if I plotted EDAD’s 5-year h-index against our colleagues in other UNL departments, that chart would look really different. But then I would be comparing apples to pineapples or limes or chili peppers, and it just wouldn’t make any sense. But that is what UNL administrators did with the metrics, and based on what my Stats friends found, they did it in a way that was weighted more heavily towards fields that publish books. That is great for our friends in the humanities, but is not an accurate reflection of all the diverse ways fields count research or the funding opportunities available in that field.
I don’t want to be compared to Chemistry or Advertising and found lacking. I want to be compared to my field. And while I’m not among my rockstar colleagues above that trend line, I more than hold my own and the university metrics cannot take that from me.
